
COVID-19 Testing: How India is Acing the Race to Flatten the Curve with Bayes’ Theorem
- Tejas Rokhade

- Apr 28, 2020
- 7 min read

As per WHO, Stage 3 is when the source of the infection for a large number of cases remains unidentified and according to the central government, India has not entered Stage 3 of COVID 19 and is not even in the community transmission phase of the virus. So is the secret behind the low positive rates in the country of 1.3 billion just low testing numbers? Are there problems in calculations, do we have a stronger immunity than our counterparts? For all these questions dancing in your doubtful minds, let’s analyse using basic school mathematics – Bayes’ Rule. Complete Coverage: Coronavirus
Crux of the Matter
Coronavirus, a textbook case of Bayes’ Theorem? Bayes’ theorem is a method for calculating the validity of beliefs (hypotheses, claims, propositions) based on the best available evidence (observations, data, information). In terms of medical testing of COVID-19 for a prospective patient, the illustration below demonstrates the connection between a doctor’s initial belief and final belief.
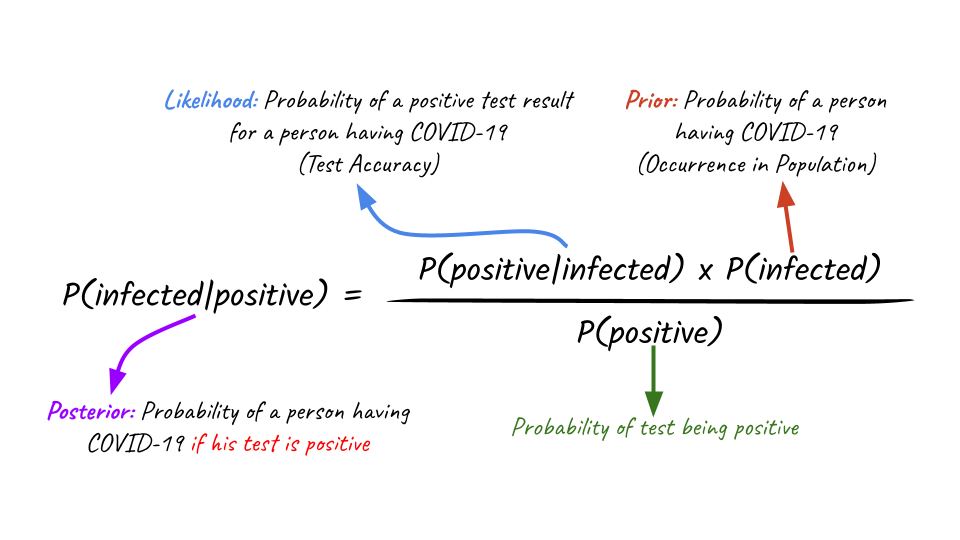
Prior (initial belief) v/s Posterior (final belief)
POSTERIOR = Probability of a person being infected with COVID-19, given the test results are positive LIKELIHOOD = Probability of a positive test result, given the person is infected with COVID-19 PRIOR = Probability of a person being infected with COVID-19
False positive and false negative, both can be dangerous. Thus for the popular COVID-19 diagnosis tests ‘RT-PCR’ to be accurate, true positives + true negatives / all results should be calculated.
A Back of the Envelope Calculation
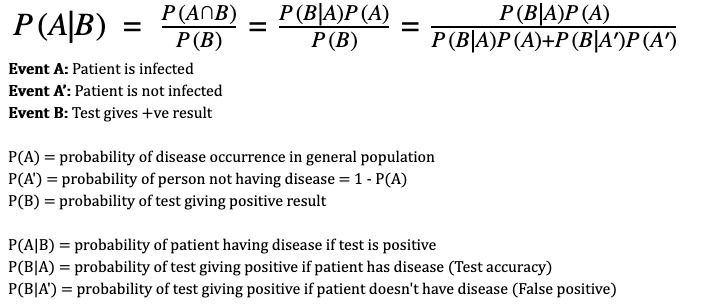
Bayes’ Theorem
Let’s say the probability of occurrence of a disease in a general population is 1% and we use a test that is 99% accurate. Then, as per Bayes’ theorem, the chances that a randomly tested person who tests positive actually has the disease is 50% – or as good as a coin toss! How?
Scenario 1: Say we test 10,000 random people. Based on 1% probability of occurence of disease, there would be 100 infected. Since the test is accurate 99% of the times, of these 100 it will show positive for 99 and negative for 1. And for the remaining 9,900 people, it will show negative 99% times and positive 1% times – 99 people with false positives. So, in the sample of 10,000 people it will tag 198 people positive of which only 99 actually have the disease – i.e. 50% of the positive results correspond to actual patients. Let’s call this the effectiveness of the test.
Scenario 2: If instead, we use a more targeted approach and test a localised population where the likelihood of disease is high, say 10%. So, in a sample of 10,000 we would have 1000 infected. With the same 99% accurate test, of these 1000 infected, 990 would test positive and 10 negative. Of the remaining 9,000, 1% would test positive falsely i.e. 90 people. So a total of 990+90=1080 people would test positive of whom 990 would actually be patients. We now have an effectiveness of 990/1080 or ~92% effectiveness.
If scenario 1 were to be scaled, we would be wasting resources in chasing more false cases.
The following charts show how the “effectiveness” of testing increases with both accuracy of test and probability of incidence of disease in given population segment. No test can be 100% accurate, and with time as a factor in development of tests, accuracies will be low. To mitigate that and make tests more effective, a more targeted approach can be used such as contact tracing to target populations with higher likelihood of disease occurrence.
Therefore more testing is required in a region that has been tagged as a hotspot as the base rate or prior probability will be high there. Subsequently a less affected region needs less testing. This sampling bias would save the hospitals from discharging infected people (false negatives) and filling wards with healthy people (false positives), who can contract COVID-19 during their stay.
So a prudent strategy in this case is to test when the prior probability is already high. People who have travelled abroad. People who have come in contact with infected people People with respiratory illnesses. People who "travelled to Delhi". Exactly what India is doing. — Karthik (@karthiks) April 15, 2020
Of course given too small a sample size, there is likely to be more variation in probabilities computed and less confidence in the infection rates thus arrived at. As per a simulation based on Chi Square test, If we test a 1,000 people and find 1 positive, then the expected probability of incidence would be 0.1% but the true incidence of the disease could vary from 0.01% to 0.65%. But if we test a larger sample, say 100,000 people and find 100 positive, then the true incidence lies between 0.08% and 0.12%, which is an acceptable range.
Is multiple testing on the same patient a feasible solution?
In the graph which starts with 50% probability, the green point that has a 5.5% prior probability, ends up with 3.7% posterior probability, which is way past the grey threshold of acceptable risk. Thus it took 8 consecutive negative results to convince the doctor that the patient is COVID-19 negative.
Thus if it takes X tests starting from probability Y, then it will take at least X tests for any probability greater than Y to generate reliable results from unreliable tests. In layman’s terms, Any patient with an initial probability of infection greater than 8%, requires at least 2 tests to rule it out.
And what would be the cost of being wrong? As of 22 April, 4.5+ Lakh samples have been tested in India, wherein 19k+ were positive. For a country of 1.3 billion residents, this is a testing ratio of 200 per million. Understandably, we cannot test half the population without exhausting the financial and human resources of our healthcare system.
If every Indian is tested for #COVID19 the total cost will be Rs. 6,300,000,000,000 i.e. Six Lakh Thirty Thousand Crore i.e. 3.3% of GDP i.e. 64% of Total Direct Tax Collection Let that sink in. Then we can talk about tests/million data comparison with other nations. — Somesh Upadhyay, IAS (@Somesh_IAS) April 14, 2020
Absolute certainty in diagnosis is unattainable, no matter how much information we gather, how many observations we make or how many tests we perform. Jerome P. Kassirer, Nephrologist
Testing in India v/s other countries
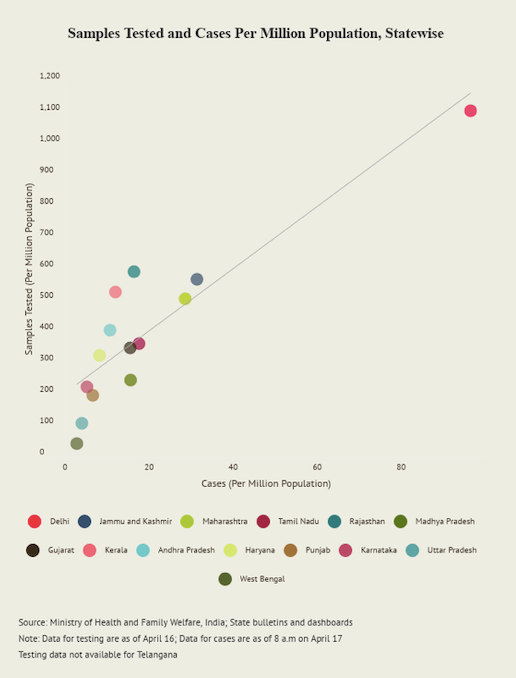
A. In India, one out of 24 cases are COVID-19 positive, as per ICMR
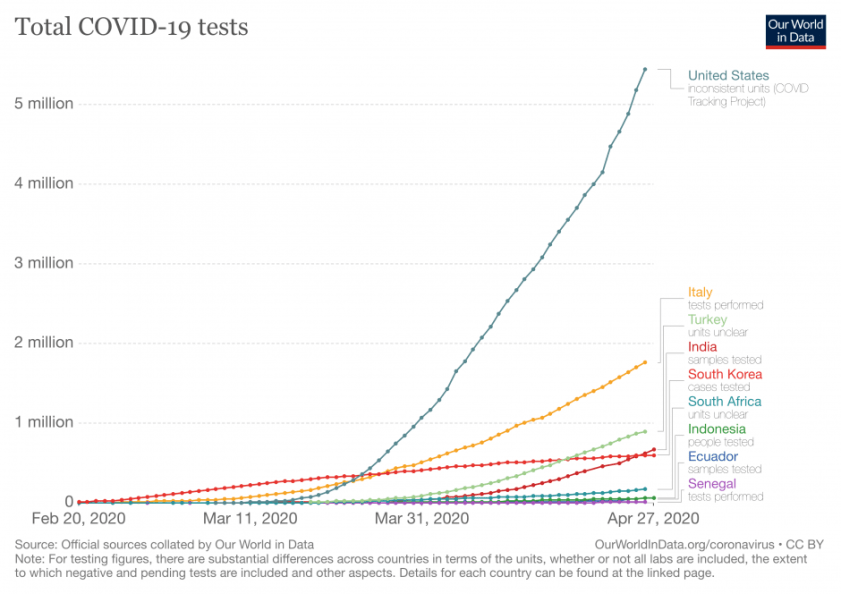
B. Slow and steady India is set to win the race in flattening the curve
India’s trace and quarantine strategy: People power As per National Centre for Disease Control (NCDC), our existing national surveillance disease outbreak network, called the Integrated Disease Surveillance Programme (IDSP) has been capturing real time data. Ever since the first COVID-19 case arrived in India in late January this year. In areas where social health care workers identify clusters of the epidemic, a containment zone is set up and everyone inside is ordered to stay at home. People who test positive are taken to isolation units or hospitals and this network has helped identify 4,000+ new cases.
Govt of India: The samples are being sent to National Institute of Virology for confirmation. Contact tracing of the persons who have come in contact with these six persons is also simultaneously being done through the Integrated Disease Surveillance Program (IDSP) network. https://t.co/aUA11npYbc — ANI (@ANI) March 3, 2020
For the asymptomatic cases, community surveillance and contact tracing is being done by the Health ministry. Additionally the Indian Council of Medical Research (ICMR) is testing the asymptomatic direct and high-risk contacts of a COVID-19 positive case along with the symptomatic healthcare workers.
Differentiated approaches: To each, their own According to K. Srinath Reddy, president of the Public Health Foundation of India, India has fared well so far in its state wise differentiation of fighting the COVID-19. Simply because we understand what works for one, may not work for the other.
One Indian state is flattening the coronavirus curve through epic levels of contact tracing and social assistance. Here’s what the rest of the world can learn from this success story. https://t.co/MpSHieckw3 — MIT Technology Review (@techreview) April 27, 2020
Like the model adopted by Kerala that allowed it to have a 70% recovery rate despite a low testing rate, was active community participation and geo-mapping those under observation. Moreover it expanded its healthcare capacity, converting a number of defunct hospitals into COVID-19 facilities.
Meanwhile Andhra Pradesh chose to deploy tech-based solutions such as an app to monitor the location of those under home quarantine and to track the travel history of those who tested positive. For Rajasthan, the Bhilwara model works, that involves a complete curfew, followed by house-to-house physical surveys by volunteers.
If India succeeds…….. this is what we will all have to hear pic.twitter.com/2rfUAMNmOc — Sanjeev Sanyal (@sanjeevsanyal) April 17, 2020
Curiopedia
Bayes Theorem was derived by Thomas Bayes. He was an English statistician, philosopher, and Presbyterian minister, known for formulating the theorem. Bayes never published what would become his most famous accomplishment, his notes were edited and published after his death by Richard Price.
Bayes theorem is also used in HIV screenings. Although some criticism for its use is that it is not accurate and can be manipulated to have favourable outcomes.
Probability is also used in sports like gambling to shift the odds to other sides. The mathematics of gambling is a collection of probability applications encountered in games of chance and can be included in game theory.
Curated Coverage
Quartz – Why India shouldn’t mimic the West in the fight against coronavirus ?
Business Today – Coronavirus: Is India testing enough people for coronavirus?
Diazyme – Why Do We Need Antibody Tests for COVID-19 and How to Interpret Test Results
The Wire – No COVID-19 Test Is 100% Right, so Their Errors and Results Are Both Important
Medium – Bayes’ Rule, Unreliable Diagnostic Testing, And Containing COVID-19
William M. Briggs – Bayes Theorem and Coronavirus: The Chance You Have It & The Chance You Die
Faculty – Explainer: What is the COVID-19 testing strategy for countries around the world?


Comments